Investigations into Socket 939 Athlon 64 Overclocking
by Jarred Walton on October 3, 2005 4:35 PM EST- Posted in
- CPUs
Application Performance
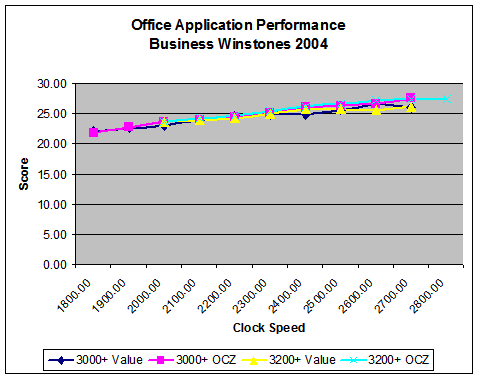
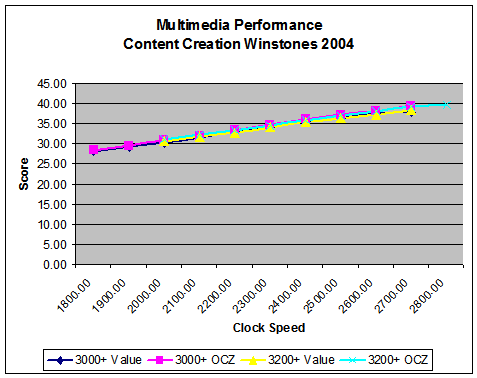
We'll start with some general application performance, courtesy of Winstones 2004. Winstones runs a bunch of scripts in a variety of real-world applications. The problem is that many of the scripts simulate user input and operate at speeds that no human can approach. Rendering an image, encoding audio or video, etc. can take time. Word, Excel, and Outlook, on the other hand, are almost entirely user-limited. While the fastest systems do perform higher, in every day use the typical office applications are going to run so fast that differentiating between the various overclocked settings is difficult, if not impossible.
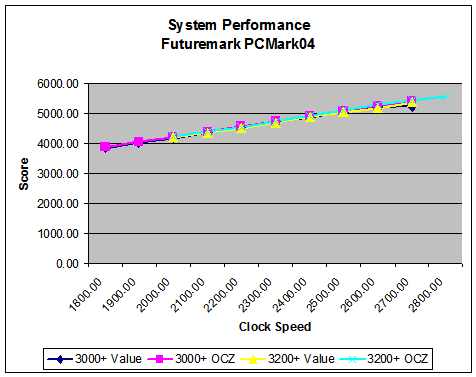
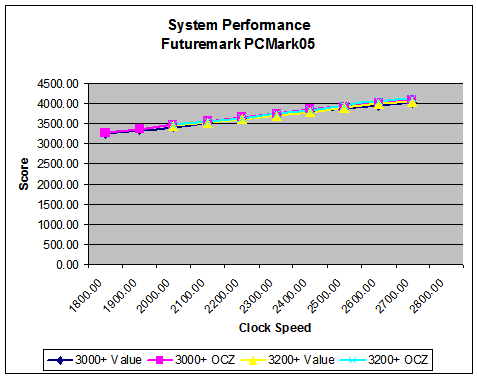
Similar in some ways to Winstones performance, PCMark attempts to gauge system performance. The results are a little more theoretical, as PCMark takes 5 to 10 minutes to run compared to 20 to 30 minutes for the Winstones tests. PCMark also includes some 2D and 3D graphics tests, which make the GPU somewhat important to the overall score. With Windows Vista moving to more hardware acceleration for windowing tasks, though, that's not necessarily a bad thing.
The difference between the slowest and fastest scores for our configuration is about the same as Winstones. PCMark04 goes from 3851 to 5567, a 45% increase. PCMark05 shows less of a difference, ranging from 3259 to 4146 (27%). PCMark05 is also the sole benchmark that we couldn't run to completion on the 2.8 GHz overclock. A couple of the tests failed every time. Both of the PCMark tests serve as great stress-tests of CPU overclocks, which is one of the reasons why we included the results. The failure to run complete PCMark05 at 2.80 GHz means that we definitely won't run this particular system at that speed long-term.
In case the graphs don't convey this fact well enough, our standard application scores benefited very little from the use of higher quality RAM. While the 2T command rate on the 9x300 value configuration did worse than the 9x289 value configuration, nearly all of the other tests show increasing performance, even with slightly lower memory speeds and latencies. The biggest gap between the value and performance RAM was in Business Winstones at 2.4 GHz, and even then, it was only a 5% margin of victory.
We'll start with some general application performance, courtesy of Winstones 2004. Winstones runs a bunch of scripts in a variety of real-world applications. The problem is that many of the scripts simulate user input and operate at speeds that no human can approach. Rendering an image, encoding audio or video, etc. can take time. Word, Excel, and Outlook, on the other hand, are almost entirely user-limited. While the fastest systems do perform higher, in every day use the typical office applications are going to run so fast that differentiating between the various overclocked settings is difficult, if not impossible.


Similar in some ways to Winstones performance, PCMark attempts to gauge system performance. The results are a little more theoretical, as PCMark takes 5 to 10 minutes to run compared to 20 to 30 minutes for the Winstones tests. PCMark also includes some 2D and 3D graphics tests, which make the GPU somewhat important to the overall score. With Windows Vista moving to more hardware acceleration for windowing tasks, though, that's not necessarily a bad thing.


In case the graphs don't convey this fact well enough, our standard application scores benefited very little from the use of higher quality RAM. While the 2T command rate on the 9x300 value configuration did worse than the 9x289 value configuration, nearly all of the other tests show increasing performance, even with slightly lower memory speeds and latencies. The biggest gap between the value and performance RAM was in Business Winstones at 2.4 GHz, and even then, it was only a 5% margin of victory.


101 Comments
View All Comments
photoguy99 - Monday, October 3, 2005 - link
Dual Core was not mentioned -Anyone know how difficult it is to get a stable dual-core to 2.8Ghz with water-cooling?
Easy, difficult, impossible?
JarredWalton - Monday, October 3, 2005 - link
Part two/three will cover other chips. I wanted to get the base overclocking article out, and I will be looking at both Sempron and X2 overclocking in the near future. 2.80 GHz wasn't stable on my Venice, though - not entirely - and it won't even post on my X2 3800+. Your mileage may vary, naturally, but I'm getting about 100MHz less from my X2 vs. Venice. (I'd take the second core over the extra 100MHz any day, however!)MemberSince97 - Monday, October 3, 2005 - link
Thanks for the detailed explanation and charts. Thanks for the hard work.Nunyas - Monday, October 3, 2005 - link
I'm a bit supprised that you guys forgot to mention the overclocking abilities of the venerable Athlon Thunderbirds with the AXHA and AXIA steppings. I had a 1GHz T-Bird with AXHA stepping that allowed me to OC it to 1.533 GHz (53%), and it's documented all over the place with people achieving even better results with the same model CPU. At the time that the 1GHz became a great OC'er it was around $99 and gave you the performance of the then high end Athlons and P4's. Thus, by far a better OC'er than the Celeron 300A.OvErHeAtInG - Monday, October 3, 2005 - link
Meh, my AXIA 1.2 would do 1.4 or 1.33 sorta stable, with really good cooling, tweaked voltage, and so forth. When I sold it to my friend I had to put it back to stock speeds just so it would stay stable in the hands of someone who doesn't monitor her CPU temperature all the time ;) My "B" Northwood, IMO, is a more stable OC'er. Having said that, I guess others were more lucky than me... but yeah no 300A killer IMO.kmmatney - Monday, October 3, 2005 - link
The celeron 300A set the standard for overclocking. It was less the $100 (oem version) and performed better than any stock cpu you could buy, including those costing 3 times more. It really sparked the whole overclocking phenonema. Another good one was the Celeron II 500, which could easily overclock to 800 MHz. I had both of those.I had a cyrix 486DX-66 overclocked to 80 Mhz, and an AMD 586 DX4-133 overclocked to 150 MHz, but the celeron 300A was simply unbelievable at the time.
JarredWalton - Monday, October 3, 2005 - link
I didn't bother to try and include everything, especially where it was only specific steppings of a CPU. (I.e. not all T-birds did a 53% OC, right?) Anyway, I was basically an Intel user up until the Athlon XP era. I went from socket 478 with a Celeron 1.1A (OC'ed to 1.47 GHz) to the XP-M 2500+. The "history lesson" was just an introduction anyway, setting the stage. :)Aquila76 - Monday, October 3, 2005 - link
I've been waiting for a reputable site to post OC testing like this. I feel pretty good with the OC I get out of my rig (3500+ Winch @ 2.7GHz, Mem on divider) - thanks to the forums here - and it's close to what you guys acheived. I may swap to that DFI board instead as I know the A8N-SLI is holding me back.Garyclaus16 - Monday, October 3, 2005 - link
Job well done. I like how the benchmarks showed overclocking for anything 1024x768+ means nothing for games. I was aware the increase was small with high resolution..but an almost null increase in performance kind of makes me want to leave my 3200+ winchester the way it is. Do the venice cores OC better than winchesters?...JarredWalton - Monday, October 3, 2005 - link
Venice and Winchester should be about the same, though you might get an extra 100 MHz out of Venice (?). You can get higher performance at resolutions above 1024x768, but you'll need a much faster graphics card than the X800 Pro (or a 6800GT) for most of that. It depends on the game being tested as well.