Launching the #CPUOverload Project: Testing Every x86 Desktop Processor since 2010
by Dr. Ian Cutress on July 20, 2020 1:30 PM ESTCPU Tests: Encoding
One of the interesting elements on modern processors is encoding performance. This covers two main areas: encryption/decryption for secure data transfer, and video transcoding from one video format to another.
In the encrypt/decrypt scenario, how data is transferred and by what mechanism is pertinent to on-the-fly encryption of sensitive data - a process by which more modern devices are leaning to for software security.
Video transcoding as a tool to adjust the quality, file size and resolution of a video file has boomed in recent years, such as providing the optimum video for devices before consumption, or for game streamers who are wanting to upload the output from their video camera in real-time. As we move into live 3D video, this task will only get more strenuous, and it turns out that the performance of certain algorithms is a function of the input/output of the content.
HandBrake 1.32: Link
Video transcoding (both encode and decode) is a hot topic in performance metrics as more and more content is being created. First consideration is the standard in which the video is encoded, which can be lossless or lossy, trade performance for file-size, trade quality for file-size, or all of the above can increase encoding rates to help accelerate decoding rates. Alongside Google's favorite codecs, VP9 and AV1, there are others that are prominent: H264, the older codec, is practically everywhere and is designed to be optimized for 1080p video, and HEVC (or H.265) that is aimed to provide the same quality as H264 but at a lower file-size (or better quality for the same size). HEVC is important as 4K is streamed over the air, meaning less bits need to be transferred for the same quality content. There are other codecs coming to market designed for specific use cases all the time.
Handbrake is a favored tool for transcoding, with the later versions using copious amounts of newer APIs to take advantage of co-processors, like GPUs. It is available on Windows via an interface or can be accessed through the command-line, with the latter making our testing easier, with a redirection operator for the console output.
Finding the right combination of tests to use in our Handbrake benchmark is often difficult. There is no one test that covers all scenarios – streamers have different demands to production houses, then there’s video call transcoding that also requires some measure of CPU performance.
This time around, we’re probing a range of quality settings that seem to fit a number of scenarios. We take the compiled version of this 16-minute YouTube video about Russian CPUs at 1080p30 h264 and convert into three different files:
- 1080p30 to 480p30 ‘Discord’: x264, Max Rate 2100 kbps, High Profile 4.0, Medium Preset, 30 Peak FPS
- 1080p30 to 720p30 ‘YouTube’: x264, Max Rate 25000 kbps, High Profile 3.2, Medium Preset, 30 Peak FPS
- 1080p30 to 4K60 ‘HEVC’: H.265, Quality 24, Auto Profile, Slow Preset, 60 Peak FPS
These three presets, starting from the same source video, give a scaling set of results showing what might be best for video chat (1), streaming (2), or upconverting offline (3). We will see most CPUs can manage (1) in realtime, (2) might be a challenge, and (3) is only for the expensive systems.
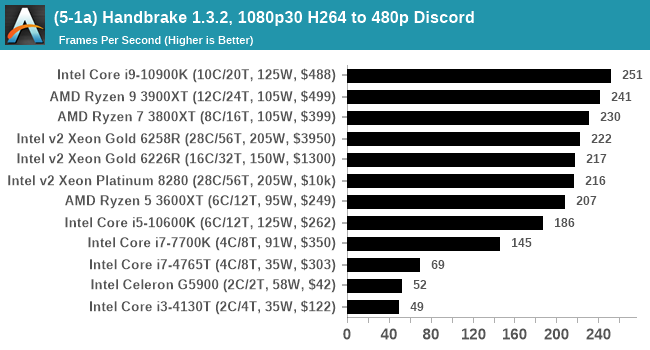
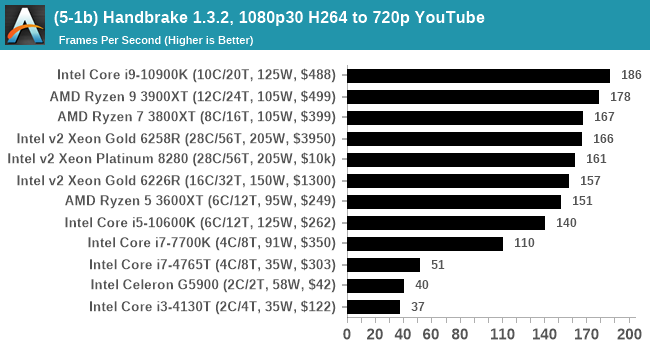
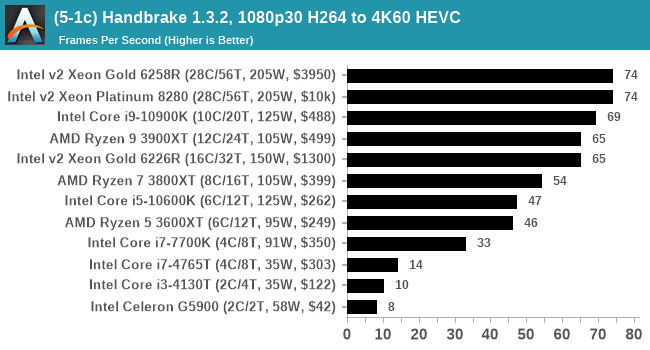
This is one of our longer tests, with a good system taking between 30-60 minutes and slow systems taking several hours. The LQ test typically favors a good single thread speed due to the low amount of memory per frame, while the HEVC test can spread out to more cores and favors big and fast caches as well as good memory.
7-Zip 1900: Link
The first compression benchmark tool we use is the open-source 7-zip, which typically offers good scaling across multiple cores. 7-zip is the compression tool most cited by readers as one they would rather see benchmarks on, and the program includes a built-in benchmark tool for both compression and decompression.
The tool can either be run from inside the software or through the command line. We take the latter route as it is easier to automate, obtain results, and put through our process. The command line flags available offer an option for repeated runs, and the output provides the average automatically through the console. We direct this output into a text file and regex the required values for compression, decompression, and a combined score.
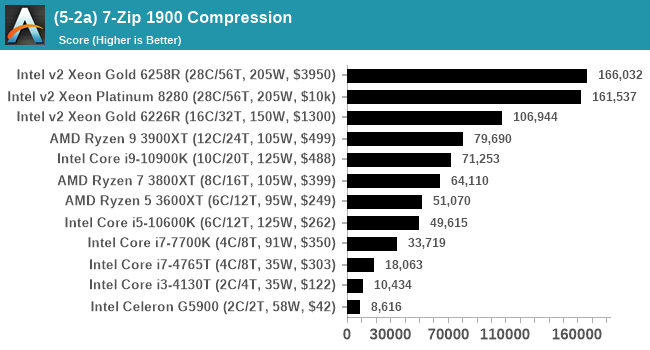
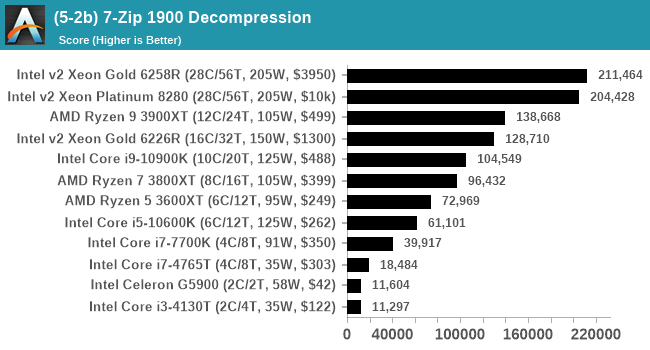
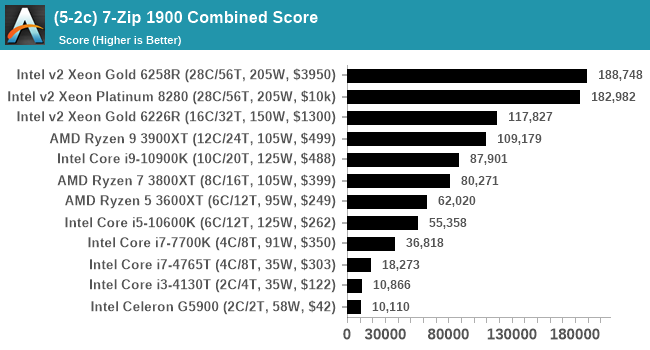
Ultimately this is more of a synthetic benchmark test. We perform a real-world test using WinRAR.
AES Encoding
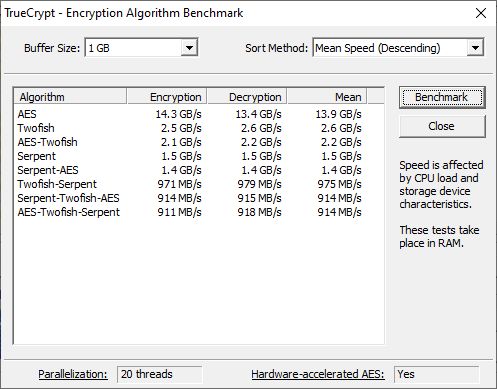
Algorithms using AES coding have spread far and wide as a ubiquitous tool for encryption. Again, this is another CPU limited test, and modern CPUs have special AES pathways to accelerate their performance. We often see scaling in both frequency and cores with this benchmark. We use the latest version of TrueCrypt and run its benchmark mode over 1GB of in-DRAM data. Results shown are the GB/s average of encryption and decryption.
For automating this test, it becomes one of the most annoying tests. There is no easy way to automate aside from loading the software and emulating keyboard button presses (with enough time between each button press to ensure even the slowest system has enough time). There is no obvious end-point for the benchmark, so we have to have a fixed point to cater for all CPUs (in this case, 240 seconds, even though the fastest CPUs can be done in under 10 second), and the results are listed in a table which makes it hard to get the information from. To get this information, we end up taking a localized screenshot into the clipboard, and saving that file in our results directory. The final result has to be read from the image, and put into the database, manually.
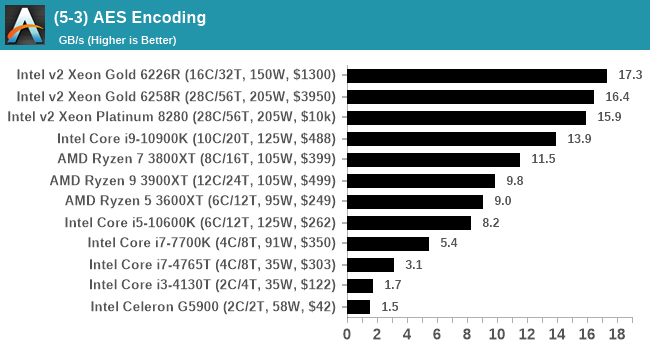
At this point we're not sure why the 3900XT doesn't do better on this test, as we believe it should be nearer 13.5-14.0 GB/s. Needs more investigation.
Despite the TrueCrypt software having ended its development, it still leaves us with a good general test for AES (and other cryptography algorithms). The results typically scale across cores and frequency, with the newest processors having AES accelerators that push the results almost to the maximum bandwidth of the DRAM.
WinRAR 5.90: Link
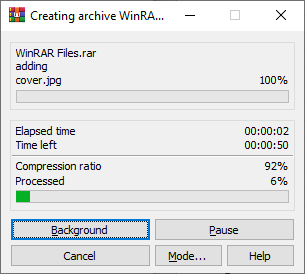
For the 2020 test suite, we move to the latest version of WinRAR in our compression test. WinRAR in some quarters is more user friendly that 7-Zip, hence its inclusion. Rather than use a benchmark mode as we did with 7-Zip, here we take a set of files representative of a generic stack
- 33 video files , each 30 seconds, in 1.37 GB,
- 2834 smaller website files in 370 folders in 150 MB,
- 100 Beat Saber music tracks and input files, for 451 MB
This is a mixture of compressible and incompressible formats. The results shown are the time taken to encode the file. Due to DRAM caching, we run the test for 20 minutes times and take the average of the last five runs when the benchmark is in a steady state.
For automation, we use AHK’s internal timing tools from initiating the workload until the window closes signifying the end. This means the results are contained within AHK, with an average of the last 5 results being easy enough to calculate.

Along with single-core frequency, WinRAR benefits a lot from memory bandwidth as well as cache type. We have seen in past that the eDRAM enabled processors give a good benefit to software like WinRAR, and it is usually where we see the biggest DRAM differences.




110 Comments
View All Comments
DiHydro - Monday, July 20, 2020 - link
This is epic. Thank you for doing this.DiHydro - Monday, July 20, 2020 - link
To add a note: I think the ~$300 CPU year-over-year performance would be an interesting metric to see. That price point seems to be pretty popular for enthusiasts, and seeing back 5-6 years how that performance has increased per dollar would be neat.bldr - Monday, July 20, 2020 - link
Agree!close - Monday, July 20, 2020 - link
It will be especially interesting to see those CPUs (the popular mainstream ones) tested now and compared to the numbers they got originally to see how much they lost with all the recent mitigations.close - Tuesday, July 21, 2020 - link
Oh, because I forgot previously, congratulations and good luck with the endeavor! I got exhausted only by reading about the work you're going to have to doFozzie - Monday, July 20, 2020 - link
Except keep in mind that adjusted for inflation $200 in the year 2000 is worth over $300 now.You'd either be making a chart of the increased value over time just due to inflation or in fact the every increasing value at the $300 price point due to the reduced value of the Dollar on top of whatever performance gains occurred.
biosstar - Friday, July 24, 2020 - link
You could also use the value of a dollar in a certain year (let's say 2020) and compare the processors in the inflation adjusted equal categories.PeterCollier - Monday, July 20, 2020 - link
What's the point of this Geekbench/Userbenchmark knockoff? I've never used AT's Bench tool. Especially not for smartphones, since the Bench tool is about 5 years out of date.BushLin - Monday, July 20, 2020 - link
A controlled environment across all tests is reason enough. Even if I don't agree with AT policy on what speed they allow RAM to operate, it is a fair comparison.Byte - Monday, July 20, 2020 - link
RAM is a really important topic. I think at this point in time, we can reasonable put almost maxed out ram for every platform. Like DDR3 can run at 2133, DDR4 we can run it at 3200 as prices are so close.It is like rating sports cars but all have Goodride tires on them.
A dodge viper was a widowmaker when it came out. Today with a good set of summers like PS4S or PZero, you will have a hard time slipping even if you tried.